Japanese Title (邦題): 「人のふり見て我がふり直せ」末尾に
Let’s look back at condition in Japan
Good morning to the World and Kanmon!
With worrying about past guests and their countries, we have watched the data about world infection of COVID-19. And we reconsidered about our country again.
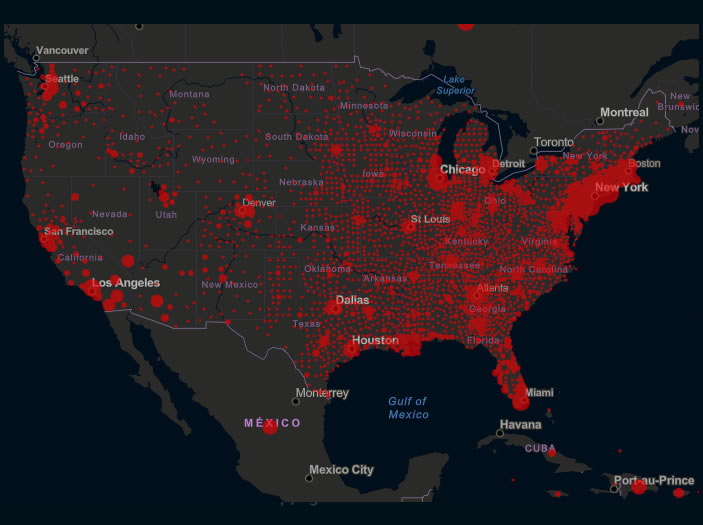
What we recognized is that there is not detail information about internal Japan, such as situation of U.S. by states. So we searched for better data about Japan and we found some referable datas.
We are guessing that our future guests will be smart enough to re-start traveling like our repeater guests and they refer infection situation/record as well as guidebook and reviews in internet to decide the place to go/stay. So we decided to share these with them here.
– Similar Formatted data about Japan as Johns Hopkins University’s global version :
“Coronavirus COVID-19 Japan Case by Each Prefecture (2019-nCoV)”
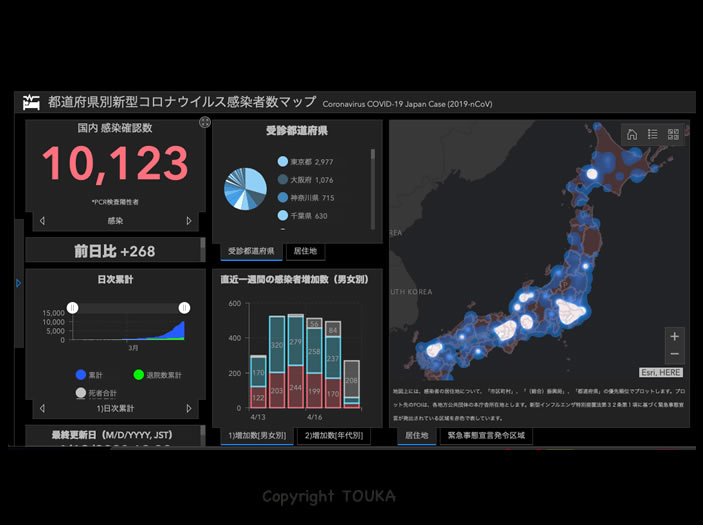
* Similar but hard to see. Good for understanding overview and more risk in big cities.
– Original and simple format for infected number by prefecture in Japan.
”Japan COVID-19 Coronavirus Tracker”
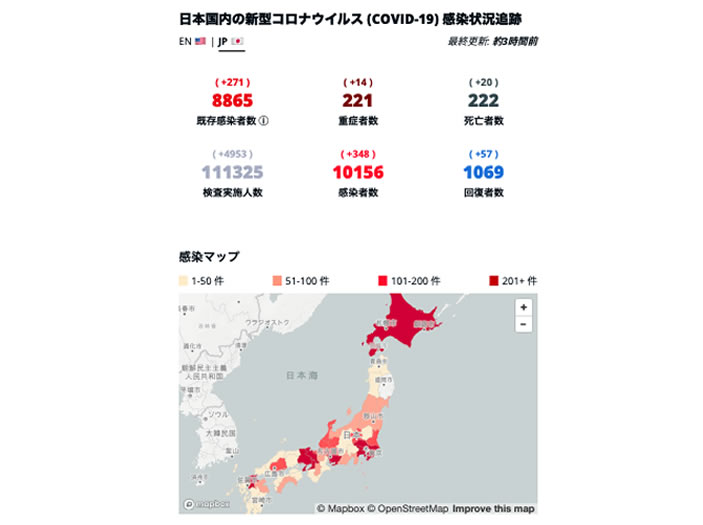
* With easy description of data, we can see character and trend of each prefecture.
It is clear that Tokyo and neighbor area is bigger number and faster speed.
– Density of infected people by prefecture, not by just number :
「【都道府県別】人口あたりの新型コロナウイルス感染者数の推移」(No English)
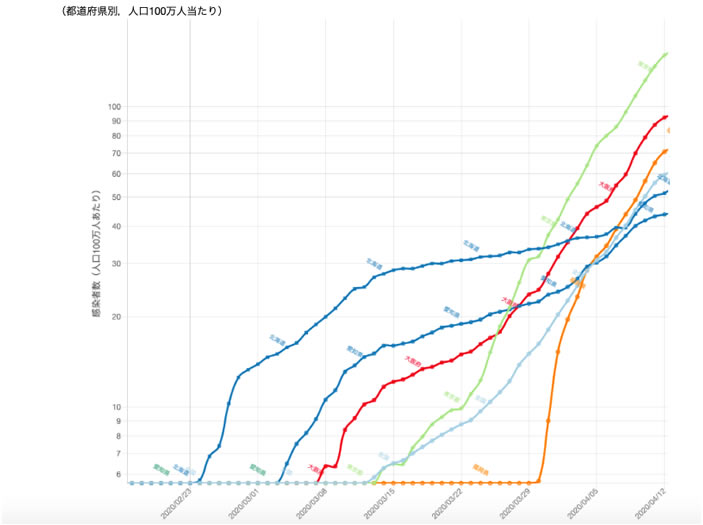
* As the comment from the viewers, flow of infection can be read from data.
We can understand why mayor of Fukuoka upset with the situation.
– The list of number by local area in Fukuoka, generated by ourselves
(using open data from Fukuoka prefecture) Please refer the last picture.
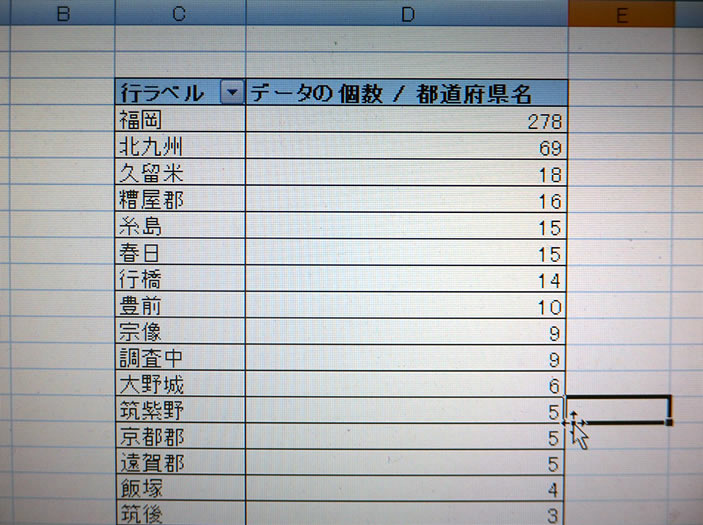
* More than half of infected people in the pref. was happened in Fukuoka city. And we can see why mayor of Fukuoka city was so hurry to set additional cooperation money for the shops/restaurant who agree to close for prevention of infection.
Thank you and you have a nice day and wonderful trip after getting correct situation and making appropriate decision.
from Yassan,
Manager of a Little Guesthouse under a Little Lighthouse TOUKA
( http://touka-kanmon.com )
人のふり見て我がふり直せ
世界中に朝が、そして関門にもあさが来ました。
おはようございます。
これまでお会いしてきたゲストの国々を心配しながら、新型コロナウイルスの海外での感染状況を見た上で、もう一度自国について見つめ直してみました。
あらためて気づいたことは、前出の全世界データには「日本」という括りしかなく、同データが示す米国の州毎の感染分布のような情報は、日本国内については分かりづらいことが分かりました。
そこでわかりやすい分析を検索してみた結果、いくつか参考になるデータを見つけました。
当宿のリピーターさん達のように、ポストコロナの初期に旅行を始めであろう未来のスマートなゲストは、従来のガイドブック・ネット口コミに加えて、日本国内の感染状況・対応なども参考にして、滞在先を決めるであろうとココでシェアしたいと思います。
● 前出の全世界データによく似たフォーマットの日本独自の国内感染分布:
「都道府県別新型コロナウイルス感染者数マップ」
*フォーマットはよく似ていますが、正直ちょっと見づらいです。
国内状況のオーバービューと大都市は危ないことが分かればよいかと思います。
● 独自のフォーマットで地域別の状況がパッと分かるデータ:
「日本国内の新型コロナウイルス (COVID-19) 感染状況追跡」
*独自フォーマットの情報は都道府県別の感染の性格・傾向がわかりやすい。
数だけでなく、増加スピードでも首都圏が抜きん出ていることがわかります。
● 数ではなく、地域別の感染密度がわかるデータ:
「【都道府県別】人口あたりの新型コロナウイルス感染者数の推移」
*データ閲覧者からのコメントにあるように地域間の感染の流れもわかります。
これをみると小川福岡県知事の慌てる理由がわかります。
● どこにもないので福岡県の公表データから独自に作ってみました。(画像参照)
福岡県内、自治体別感染者数 (4/18現在)
*福岡県内の感染は「福岡市」で半分以上が発生していることがわかります。
一つ前と併せ、高島福岡市長があわてて協力金を決断した理由がわかります。
それでは、正しく理解・判断して安全な素敵な一日・旅行を!
灯台下のちいさいゲストハウス「灯火」宿主 やっさん より
( http://touka-kanmon.com )